The default interface of sidekiq allows you to see the number of processed and failed jobs with a morgue which has all the dead jobs. The interface is sufficient when you have few queues. But when you have more queues and the number of jobs in each queue is significant then it becomes difficult to track the progress of an individual queue in sidekiq. Also to group the failure for each queue becomes a challenge because sidekiq don’t have the functionality to filter the dead jobs by the queue.
To achieve this functionality I wrote a sidekiq plugin called sidekiq_queue_metrics. The sidekiq_queue_metrics plugin provides you with the following capabilities:
- View progress of individual sidekiq queue.
- View failures of individual sidekiq queue.
- Fetching current status of queues in a hash.
Installation
Add the below code in your Gemfile to install sidekiq_queue_metrics gem
1
gem 'sidekiq_queue_metrics'
How to use sidekiq_queue_metrics?
Sidekiq queue metrics plugin is very easy to use. You just have to initialize the plugin in the sidekiq initializer and your job is done. Here is how the code will look like.
1
2
3
Sidekiq.configure_server do |config|
  Sidekiq::QueueMetrics.init(config)
end
Start sidekiq after enabling the sidekiq queue metrics plugin and you will see another table on the sidekiq UI as shown in the image below.
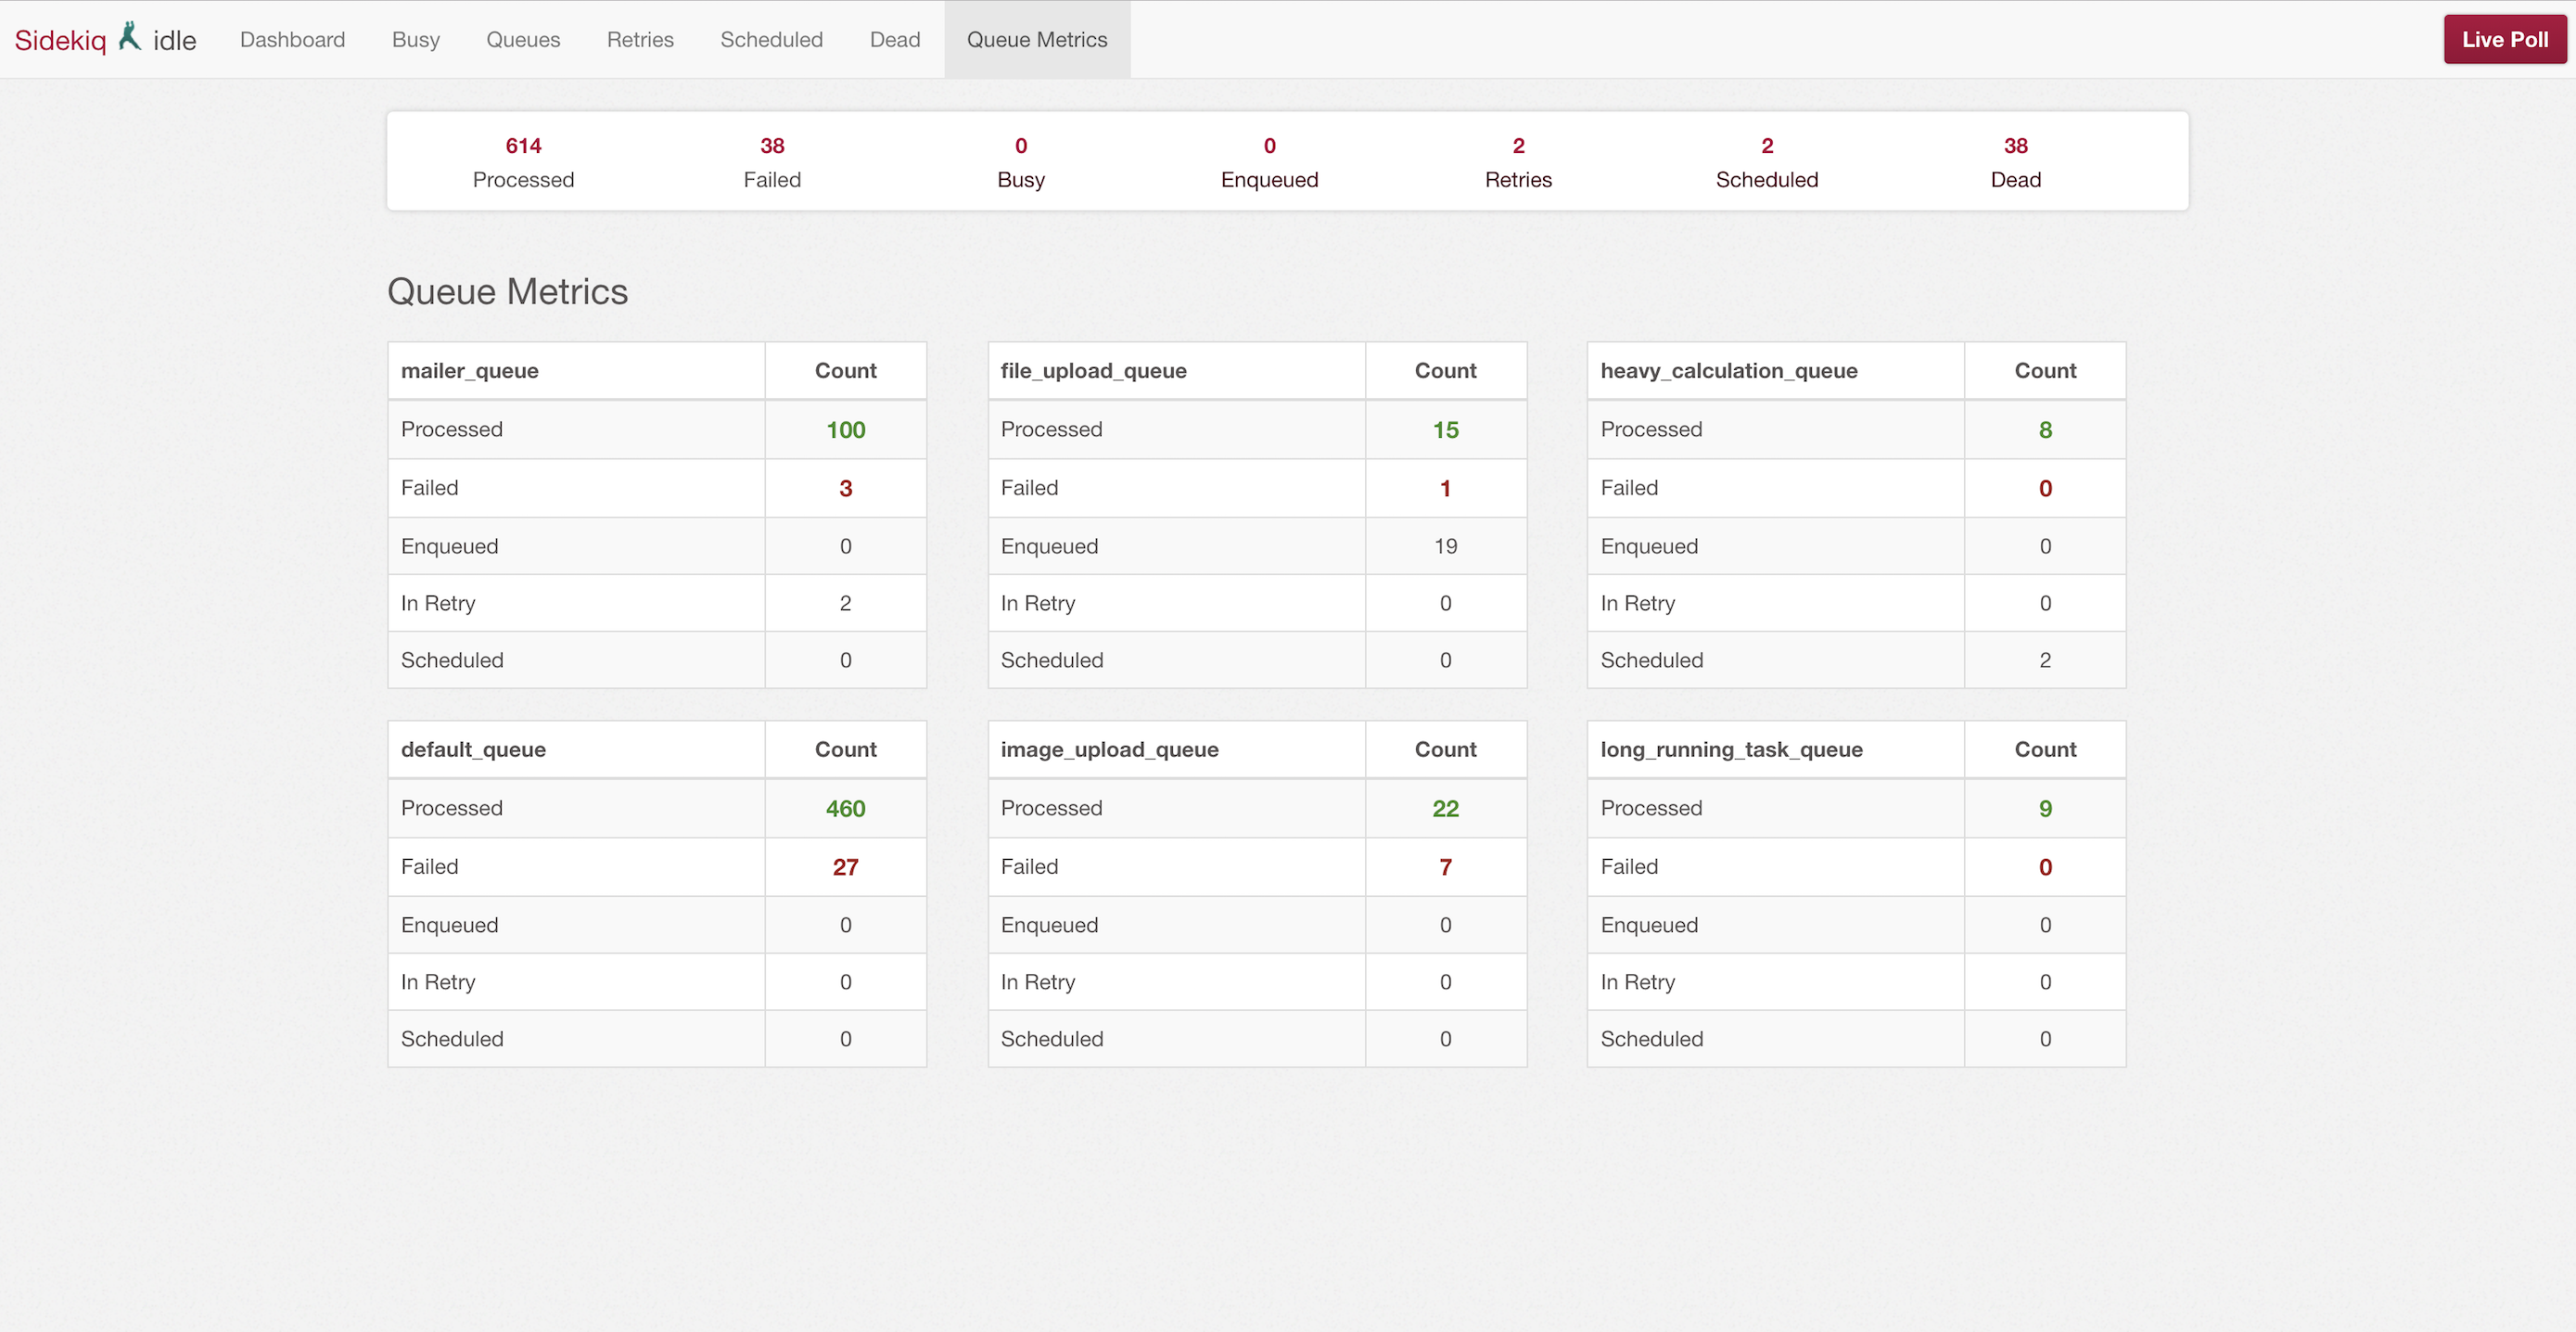
In this tab you will notice that each queue has its own widget which shows below stats of the queue:
- Processed jobs
- Failed jobs
- Enqueued jobs
- In Retry
- Scheduled jobs
To see more details of a particular queue, click on the queue name and you will be directed to queue summary page.
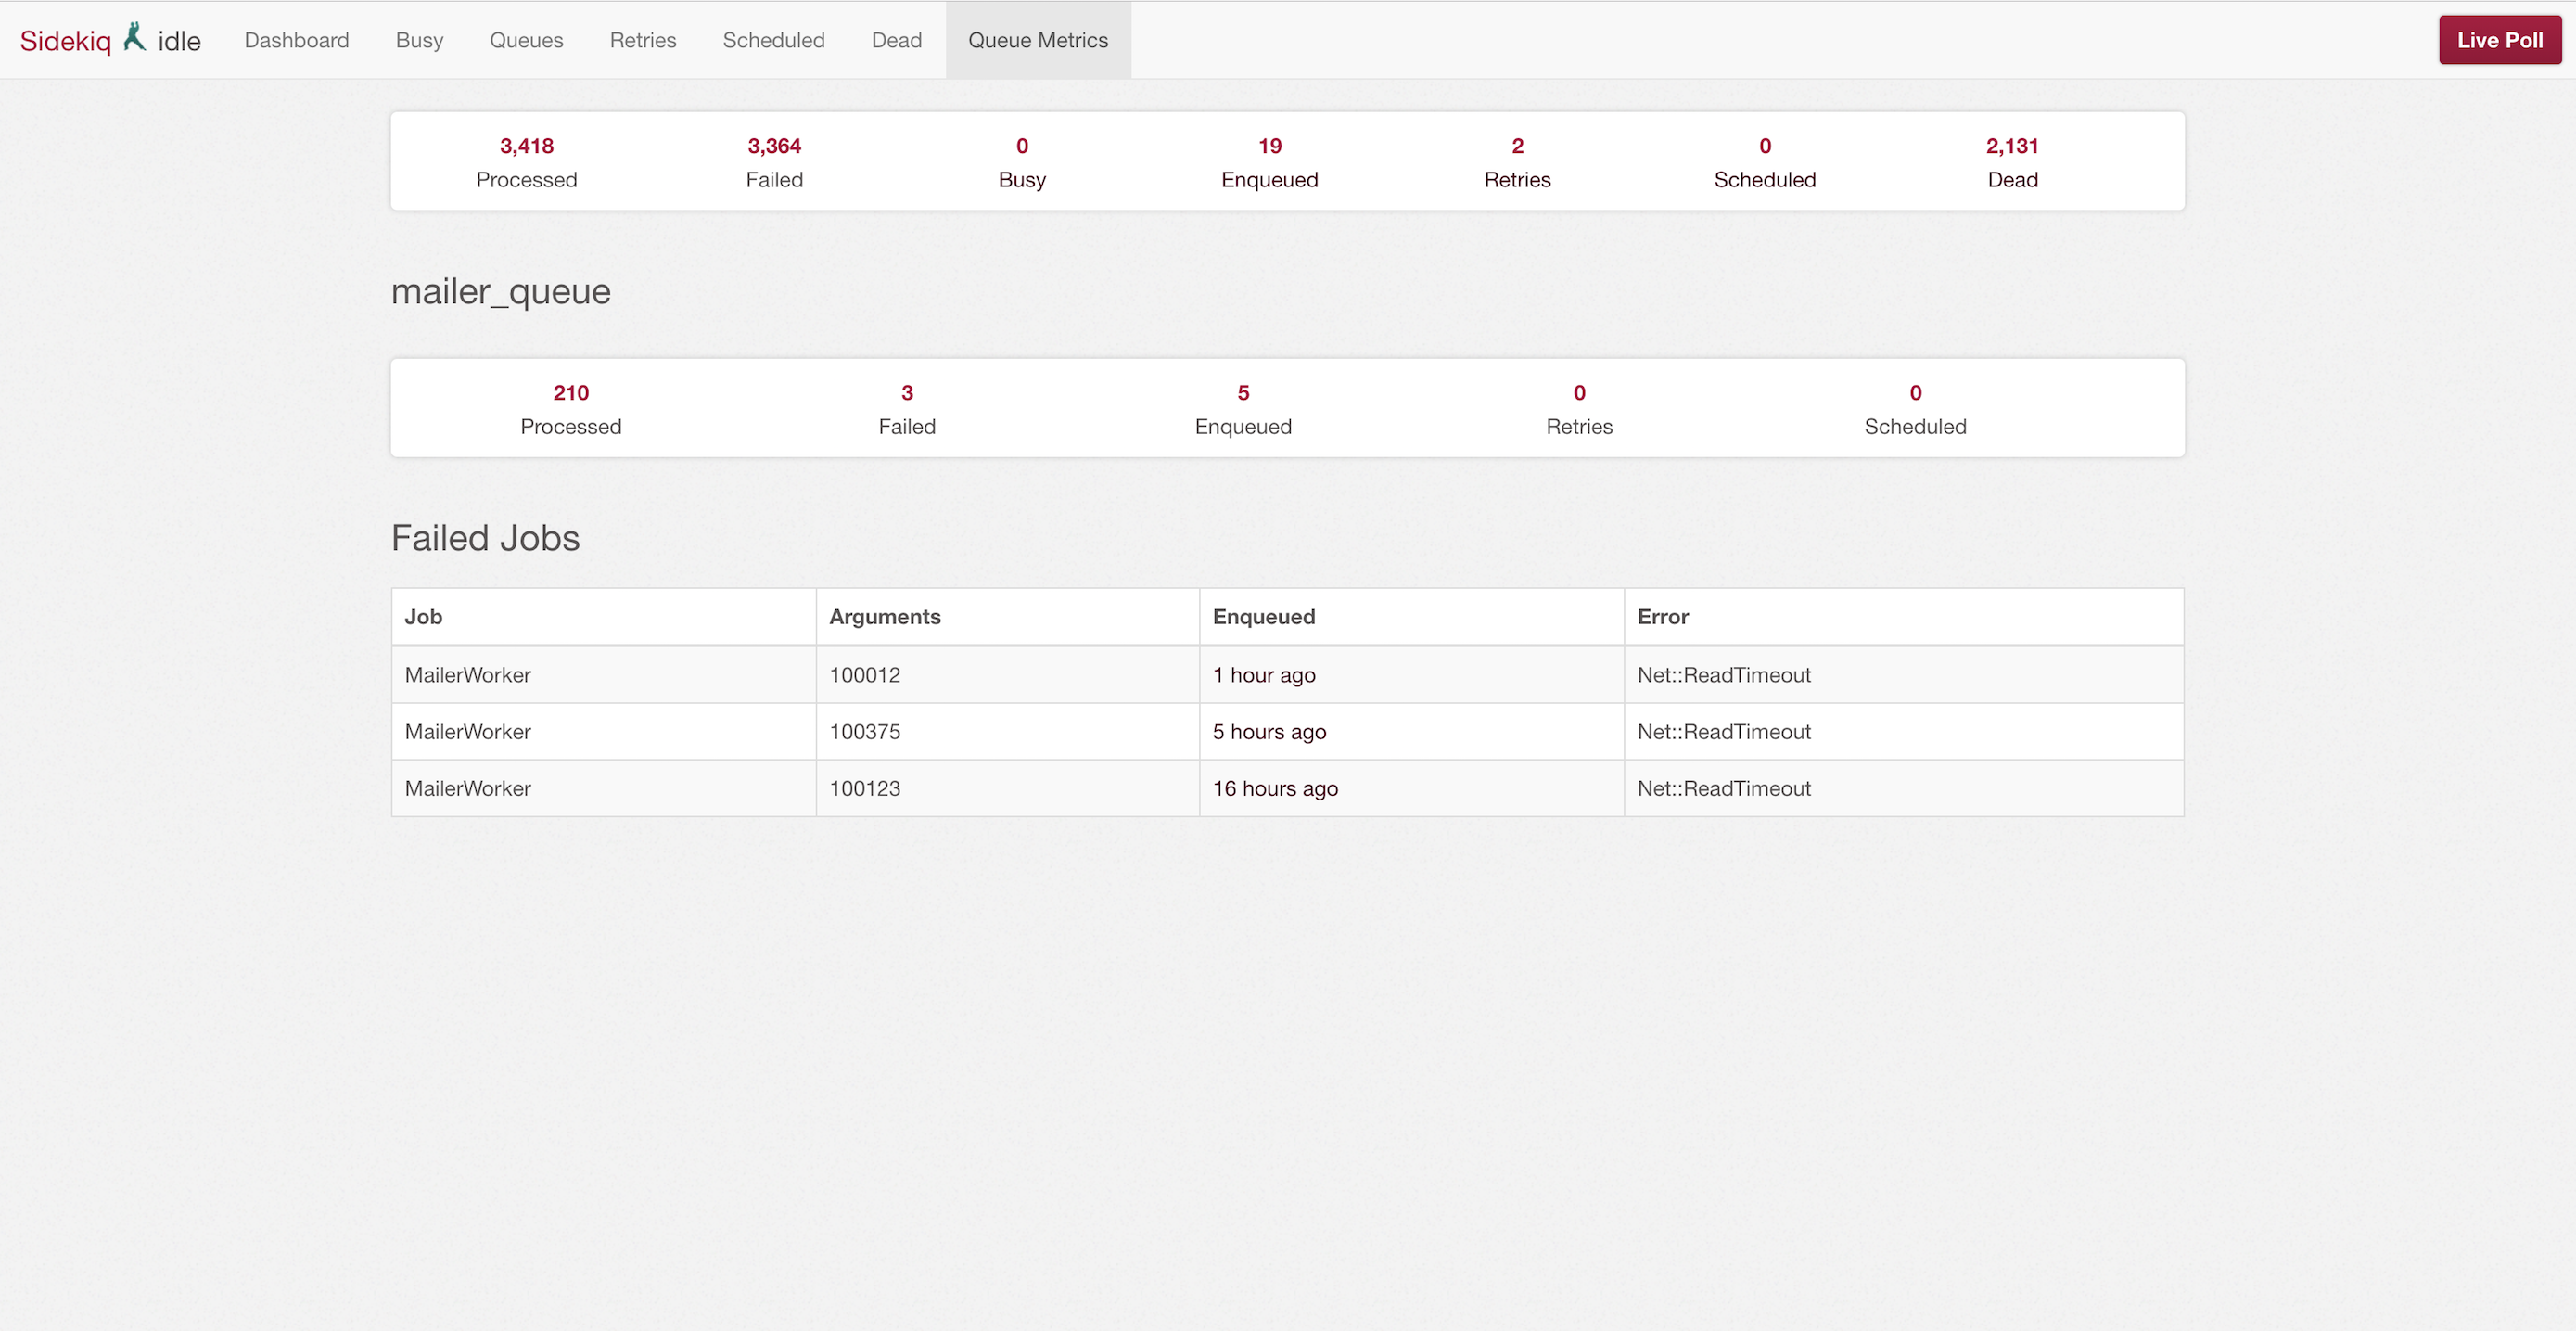
On this page you will notice that mailer_queue has its own widget that shows all the stats of the queue. Also there is a table of failed jobs. Which shows worker name, arguments, enqueued time and the error message of each failure. By default, the plugin shows 50 recent failures of a queue. You can configure that number according to your needs with below config.
1
Sidekiq::QueueMetrics.max_recently_failed_jobs = 200
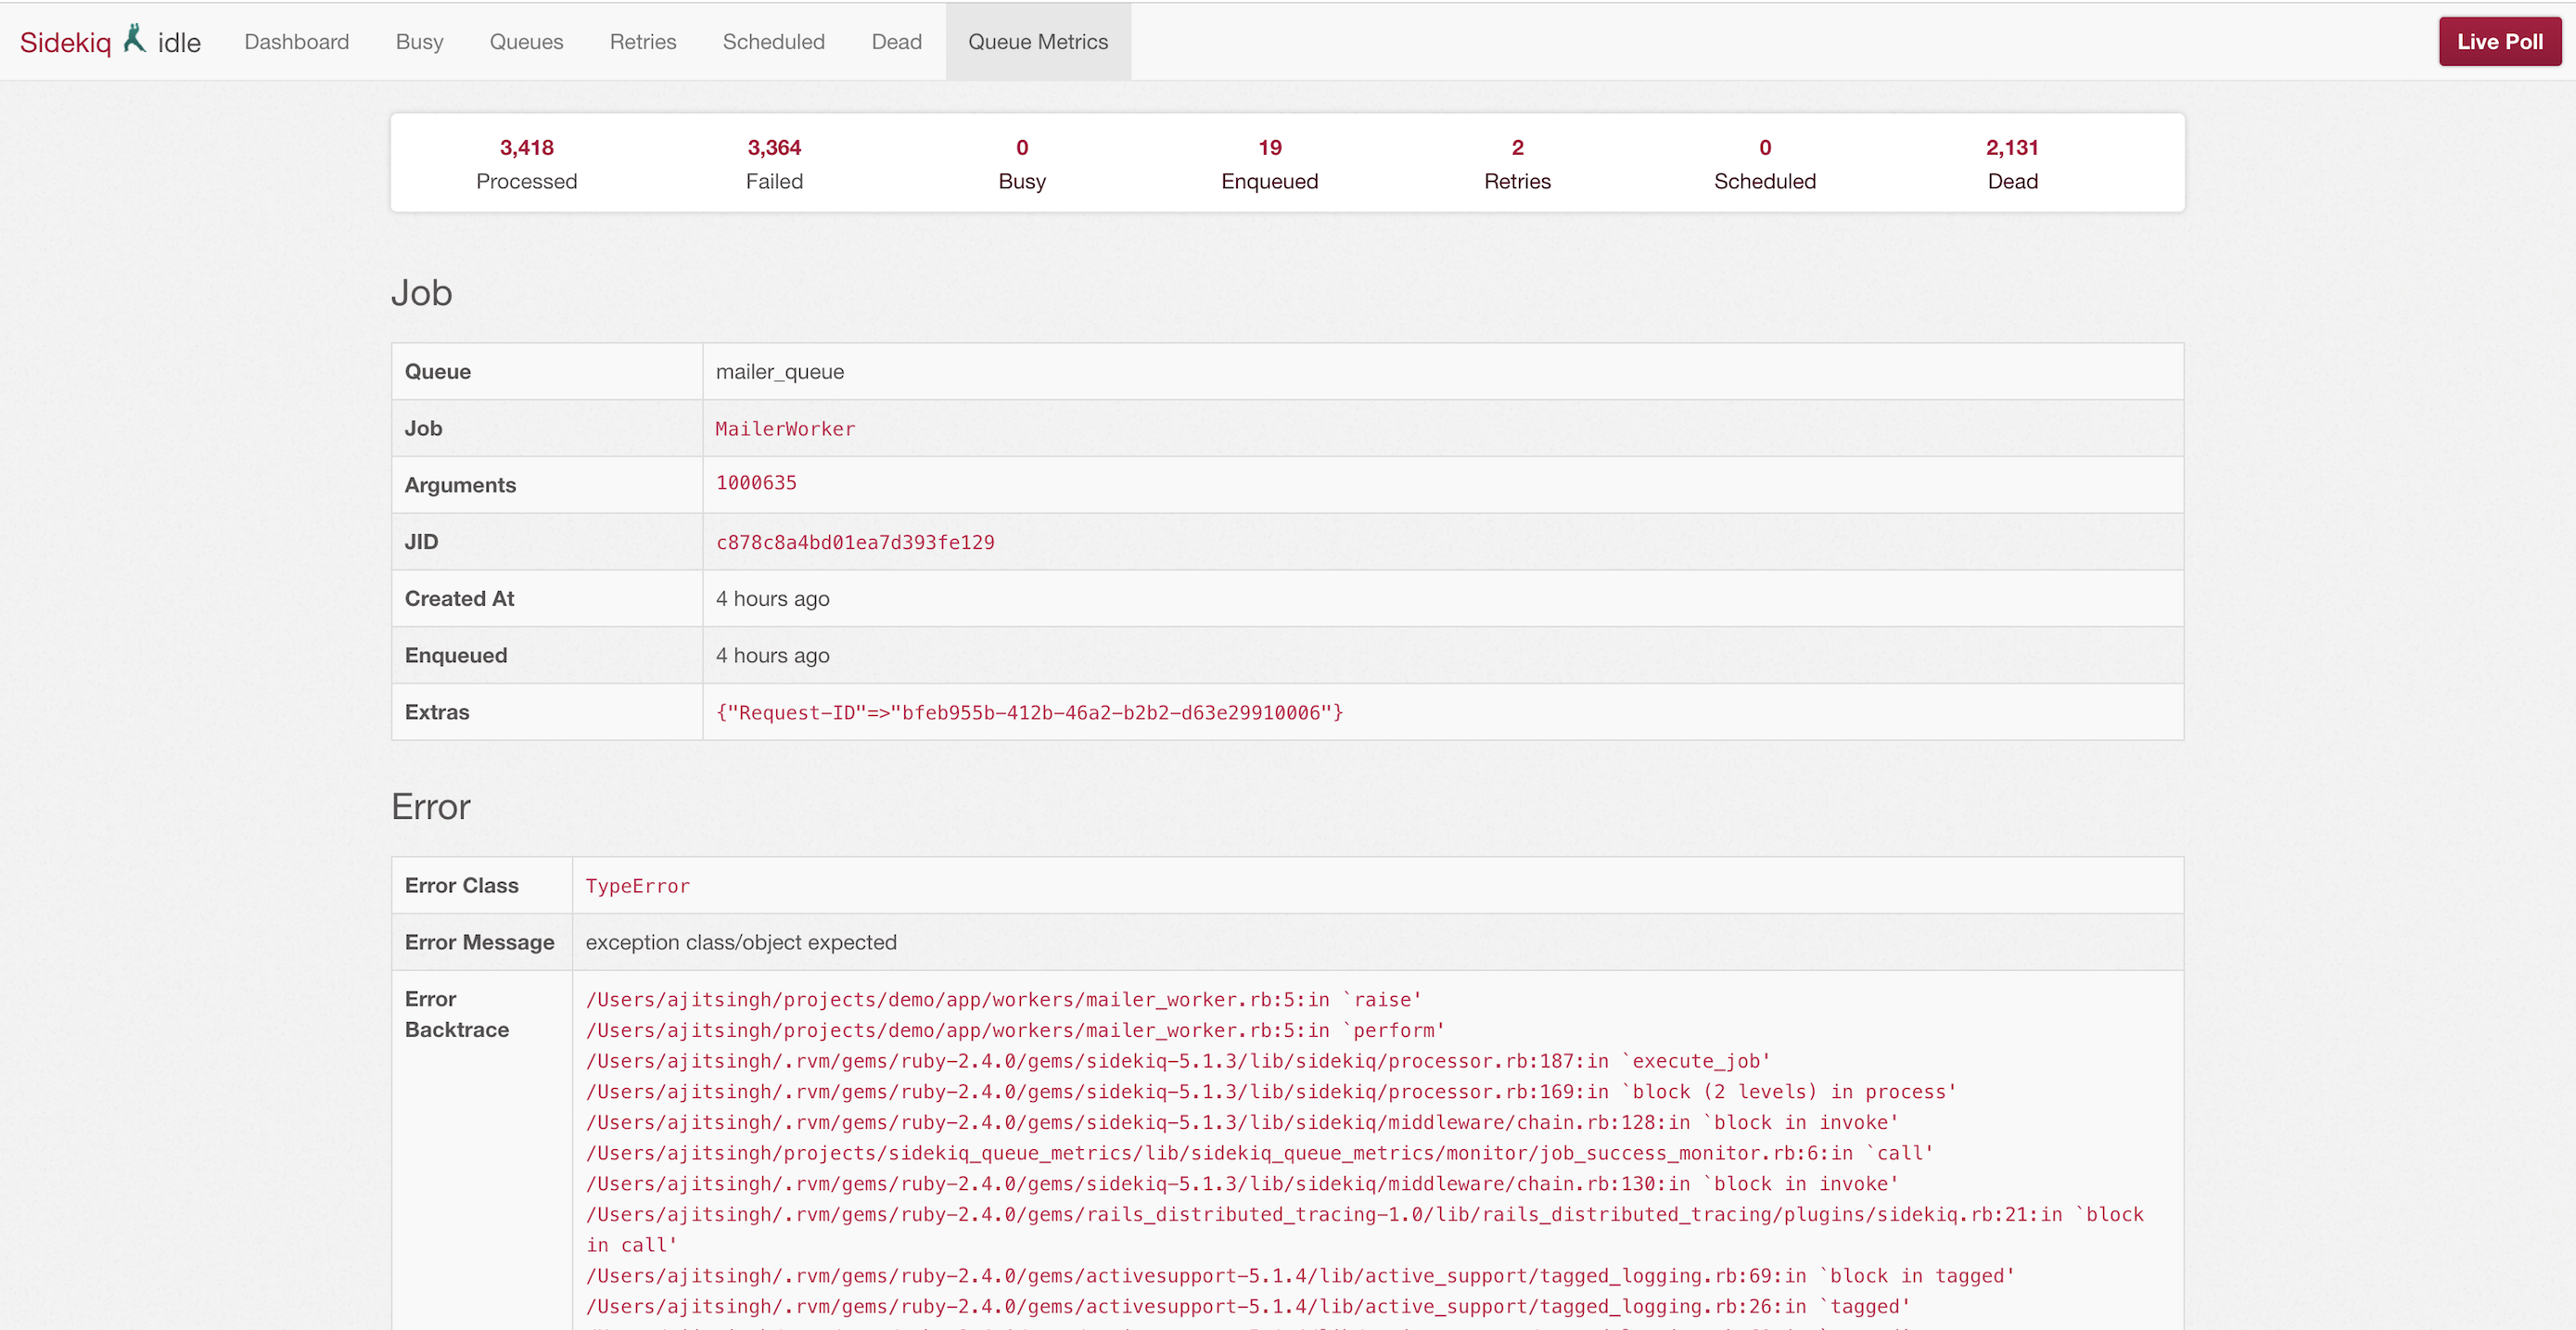
To view the details of individual job failure, click on the enqueued time of the failed job and you will be directed to another page which shows the job failure in details along with the stacktrace as shown below.
Fetching stats of all queues
You can use the below api to fetch the stats of all the queues.
1
Sidekiq::QueueMetrics.fetch
This code will return the queue stats in a hash.
1
2
3
4
{
  "mailer_queue" => {"processed" => 5, "failed" => 1, "enqueued" => 2, "in_retry" => 0, "scheduled" => 0},
  "default_queue" => {"processed" => 10, "failed" => 0, "enqueued" => 1, "in_retry" => 1, "scheduled" => 2}
}
Want to contribute?
I hope you found this plugin useful. Share it with other devs who use sidekiq and help them by making their life easier.
You can contribute to sidekiq queue metrics gem by creating issues for features and bugs on the GitHub page. Pull requests are most welcome :)
Thats all folks!